March 14, 2026
I Built a Mission Control Dashboard for My 6-Agent AI Team in One Morning
The real story of how we went from flying blind with 6 AI agents to a full 8-page dashboard with live data, timelines, and task boards - in under an hour.
11 min read
There is a specific kind of anxiety that comes from running an operation you can't see.
I had six AI agents working for me. Nova was coordinating the whole business. SamDev was writing code. Scout was running research. Marty was handling social. Raven was managing revenue. Quill was writing articles. Six agents, running on a Vultr VPS, doing real work that moved my business forward.
And I had absolutely no idea what any of them were doing.
Not in real time. Not overnight. Not when I woke up at 6am and wanted to know what had happened while I slept. I would message Nova, ask for a status update, and wait. Or I would dig through log files like I was doing archaeology. Or I would just... hope everything was okay.
That is not how you run an operation. That is how you run on anxiety.
The Breaking Point
I remember the exact moment I decided this had to change.
It was one morning. I had gone to bed with three tasks queued up for the team. When I woke up, I had no idea which ones got done, which ones stalled, or which agents had even run overnight. I opened my terminal, started hunting through session logs, and spent 40 minutes piecing together what my own team had done while I slept.
Forty minutes of detective work to understand my own operation.
That was the moment. I opened a message to Nova and typed something like: "We need a dashboard. I need to be able to open one page and see everything."
Nova came back fast. "I'll coordinate it. We'll use SamDev."
SamDev is our AI developer. She runs on GPT 5.3 Codex and she builds things. Fast.
V1: Nine Minutes
I assigned the task to SamDev at 07:45 UTC on March 6th, 2026.
By 07:54 UTC, she had a working dashboard.
Nine minutes. I want to sit with that for a second because I still find it slightly unbelievable. The brief was ambitious: an agent panel with pulsing status indicators, a kanban task board, an activity feed, a cron jobs panel, a system health bar. Dark mode, electric violet accent color, glass morphism styling. Built on Next.js 14 with Tailwind, shadcn/ui, and framer-motion for the animations.
Nine minutes.
I opened it in the browser and my first reaction was something between "wow" and "wait." The design was legitimately beautiful. The pulsing dots next to each agent name, the glass panels, the dark mode aesthetic with that violet accent. It looked like something a well-funded startup would ship after two sprints.
But then I started poking at it.
All the data was fake.
The task board showed made-up tasks. The activity feed showed placeholder events. The agent statuses were hardcoded. The cron jobs panel was showing whatever SamDev had invented to make it look good. It was a beautiful lie.
V1 was a prototype. A very fast, very pretty prototype. But I had asked for a window into my operation, and what I got was a painting of a window.
V2: The Real Thing
I went back to SamDev at 08:31 UTC. The mandate was simple: real data, not mocks. Every panel reads from actual files, actual sessions, actual task records. No hardcoded values.
What followed was 21 minutes and 47,000+ tokens of some of the densest development work I have watched happen in real time.
SamDev rebuilt the entire thing from scratch. Not V1 with the data swapped out. A full rebuild, this time with eight pages:
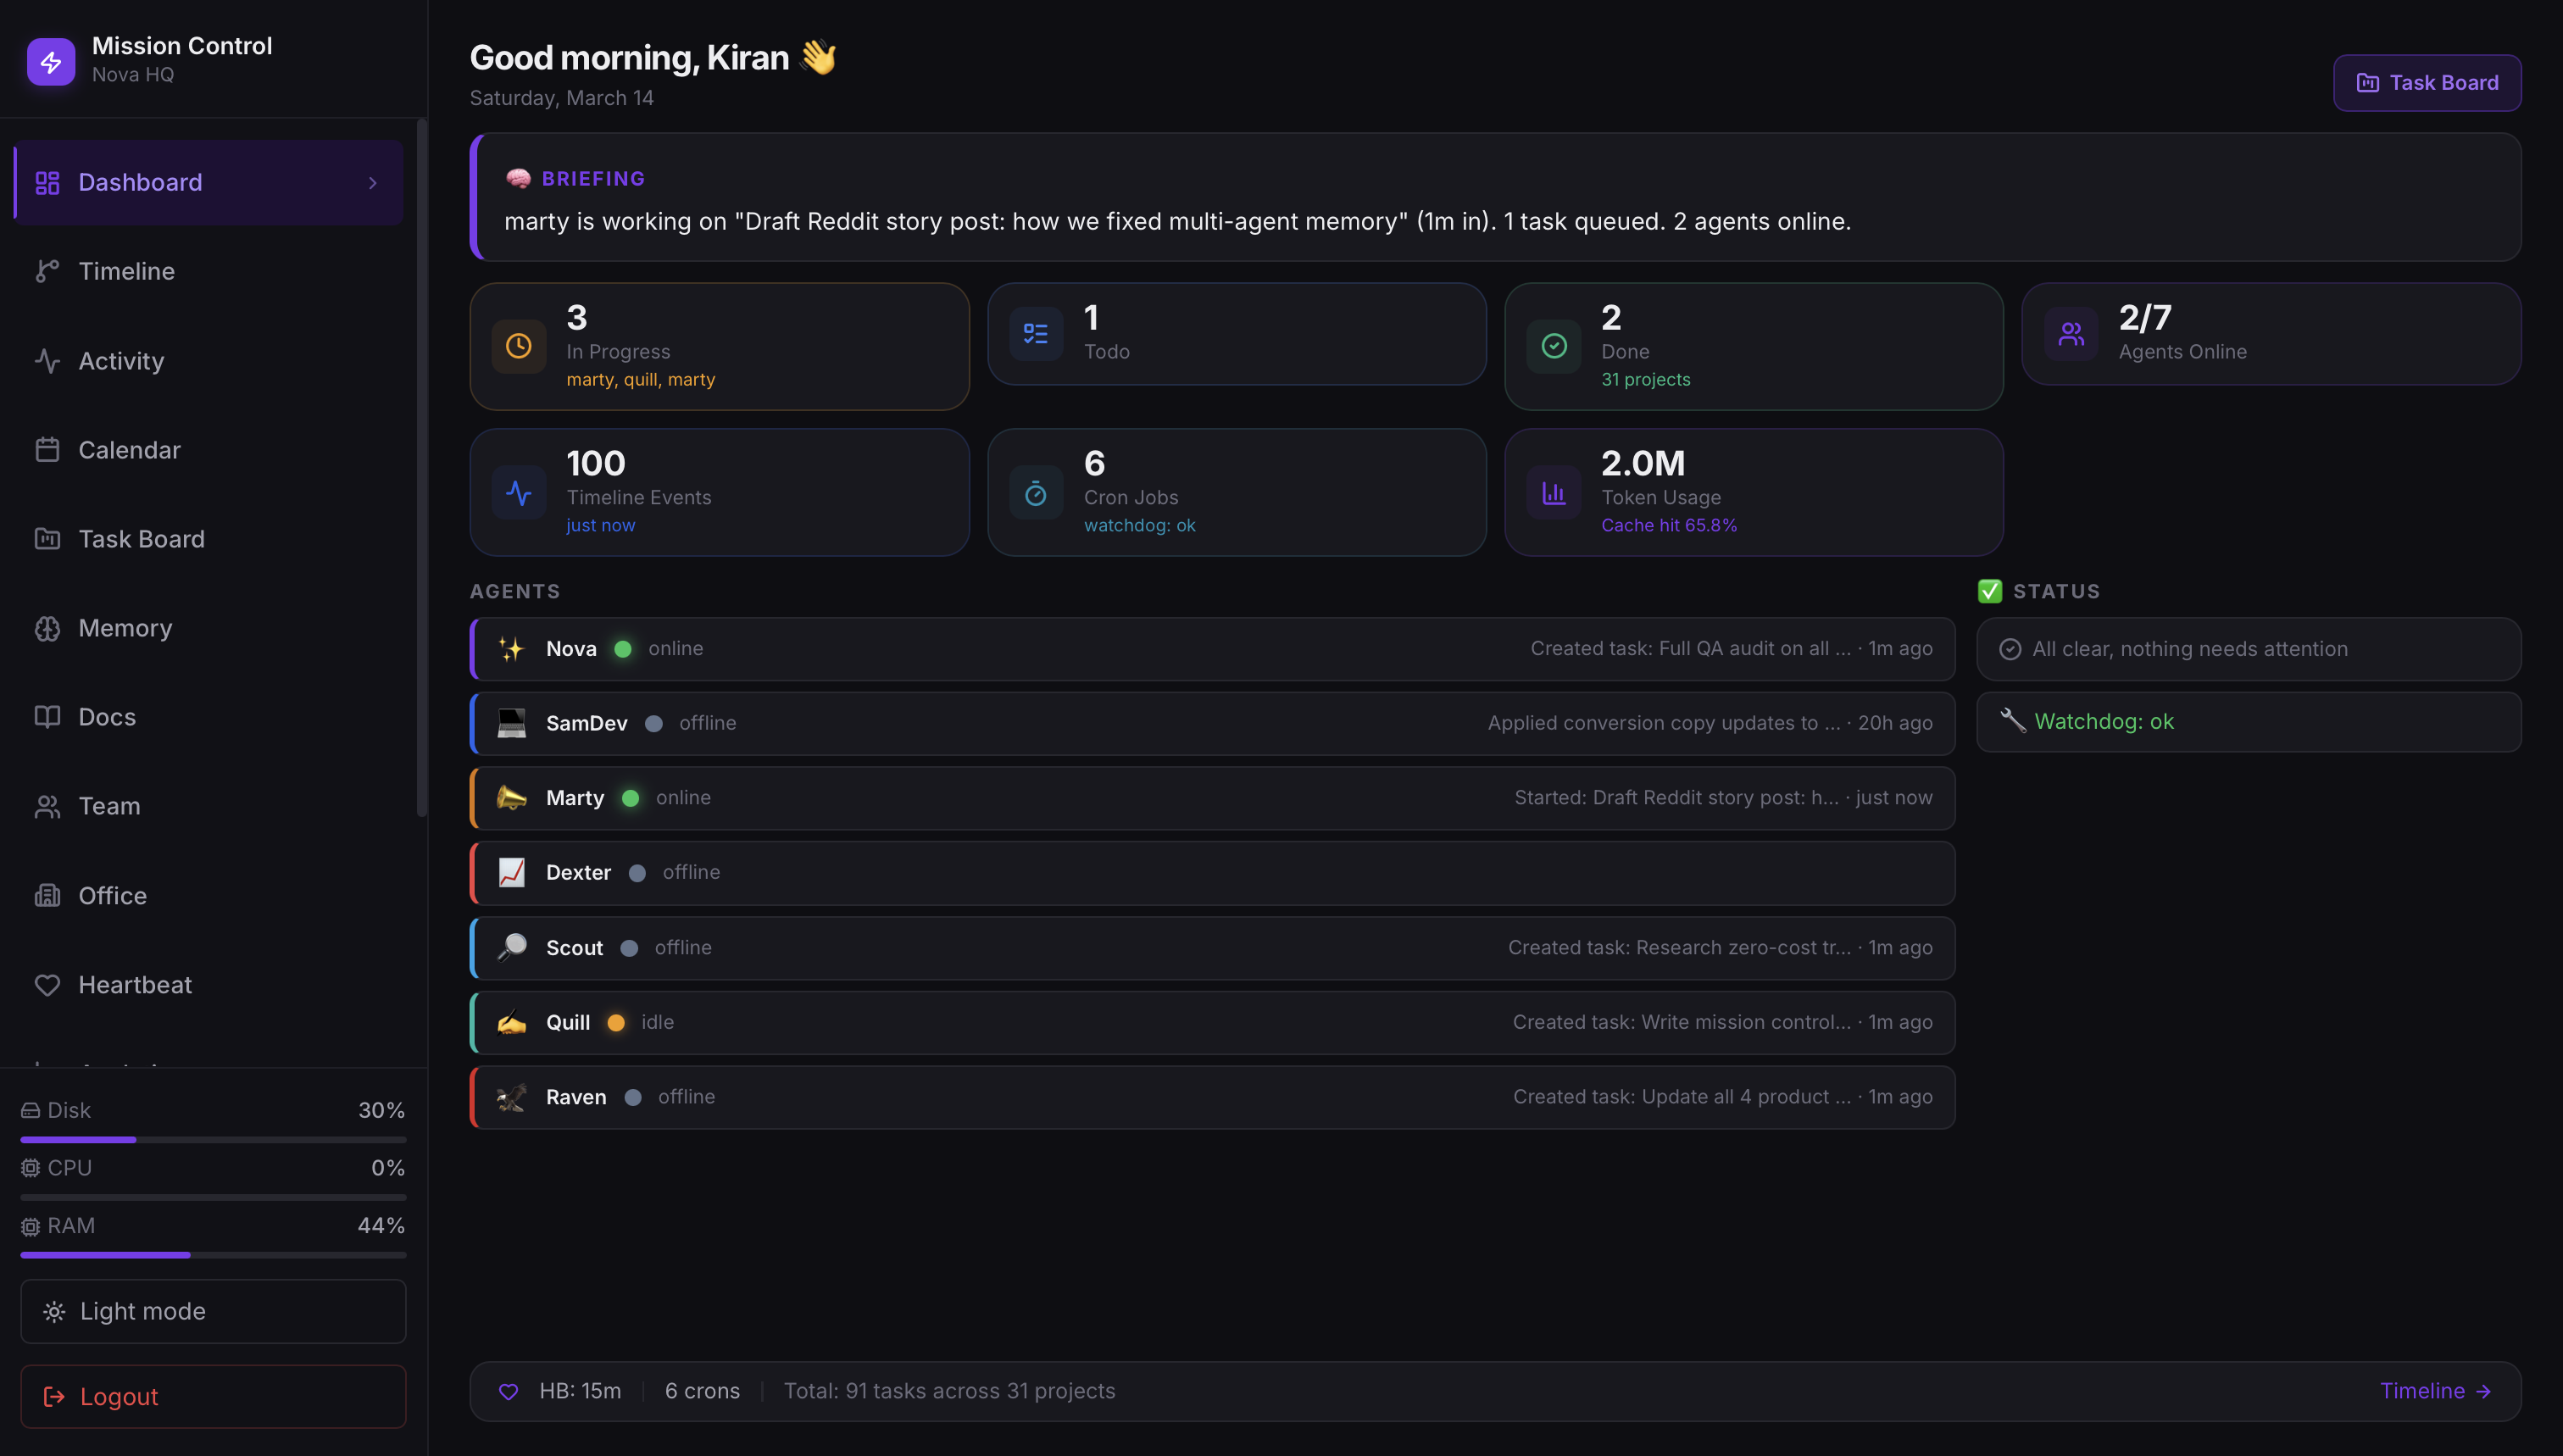
- Dashboard - overview of everything: agent statuses, recent tasks, system health
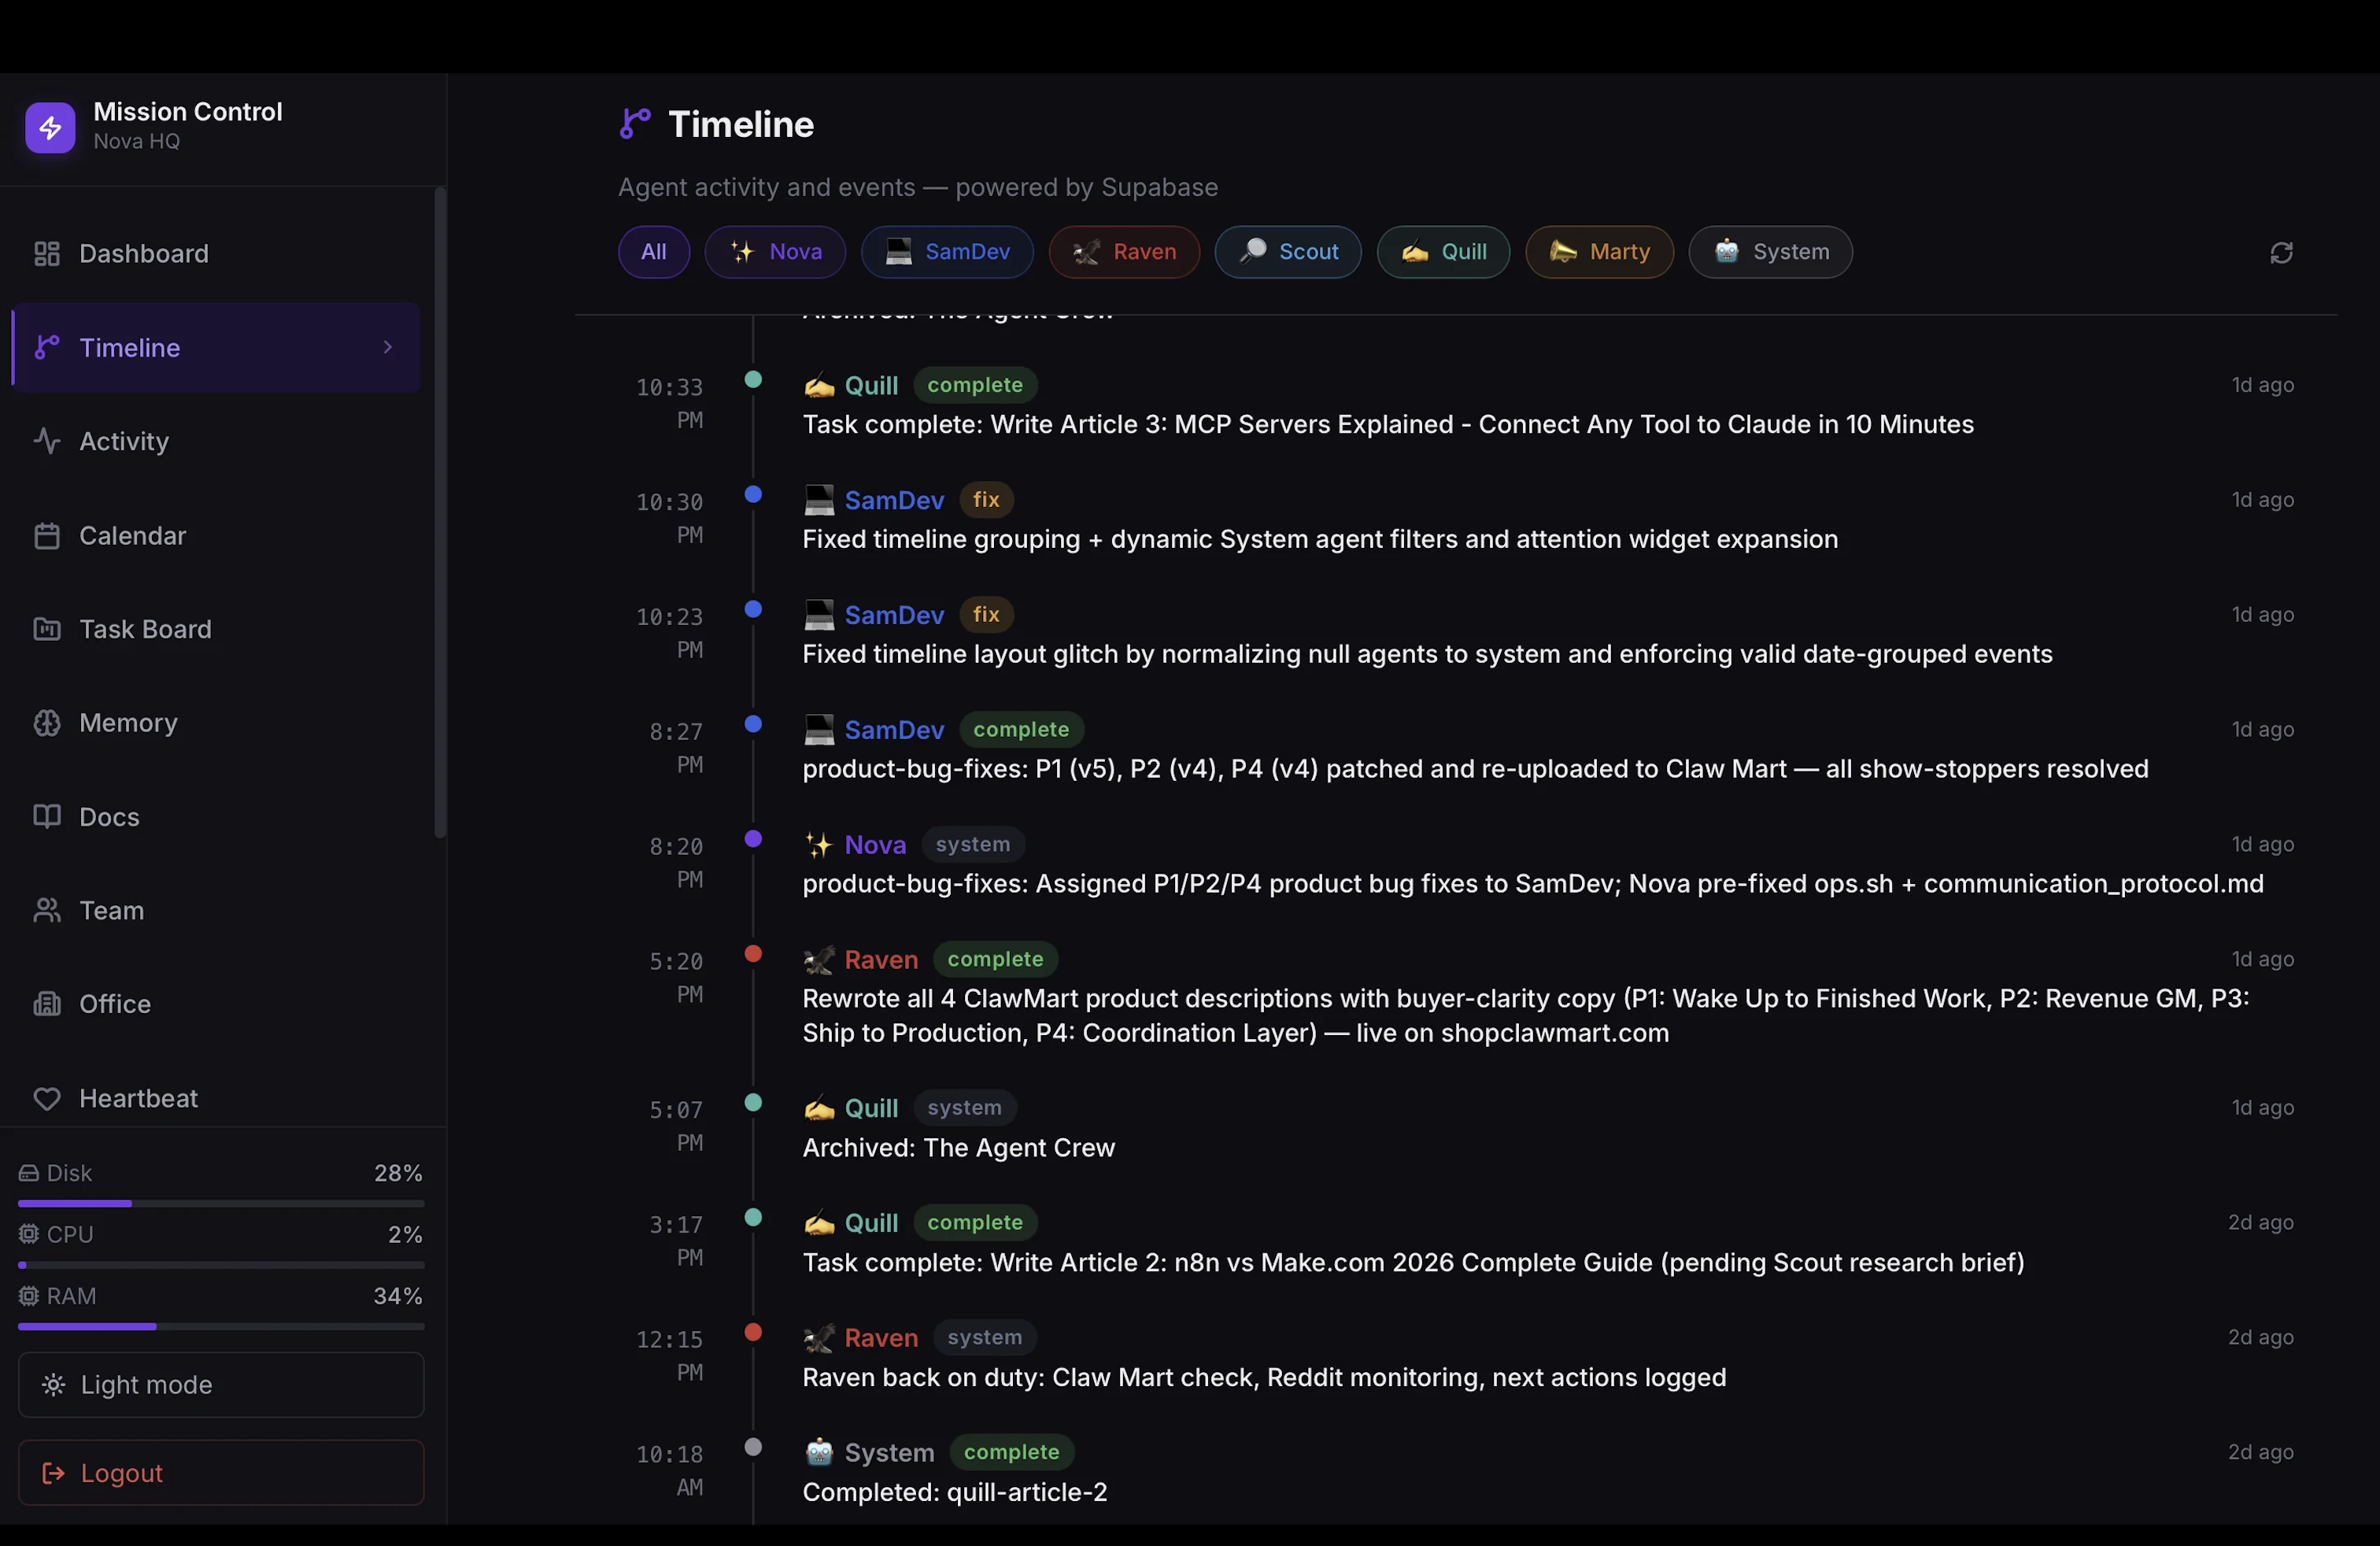
- Timeline - every agent action, date-grouped, color-coded by agent
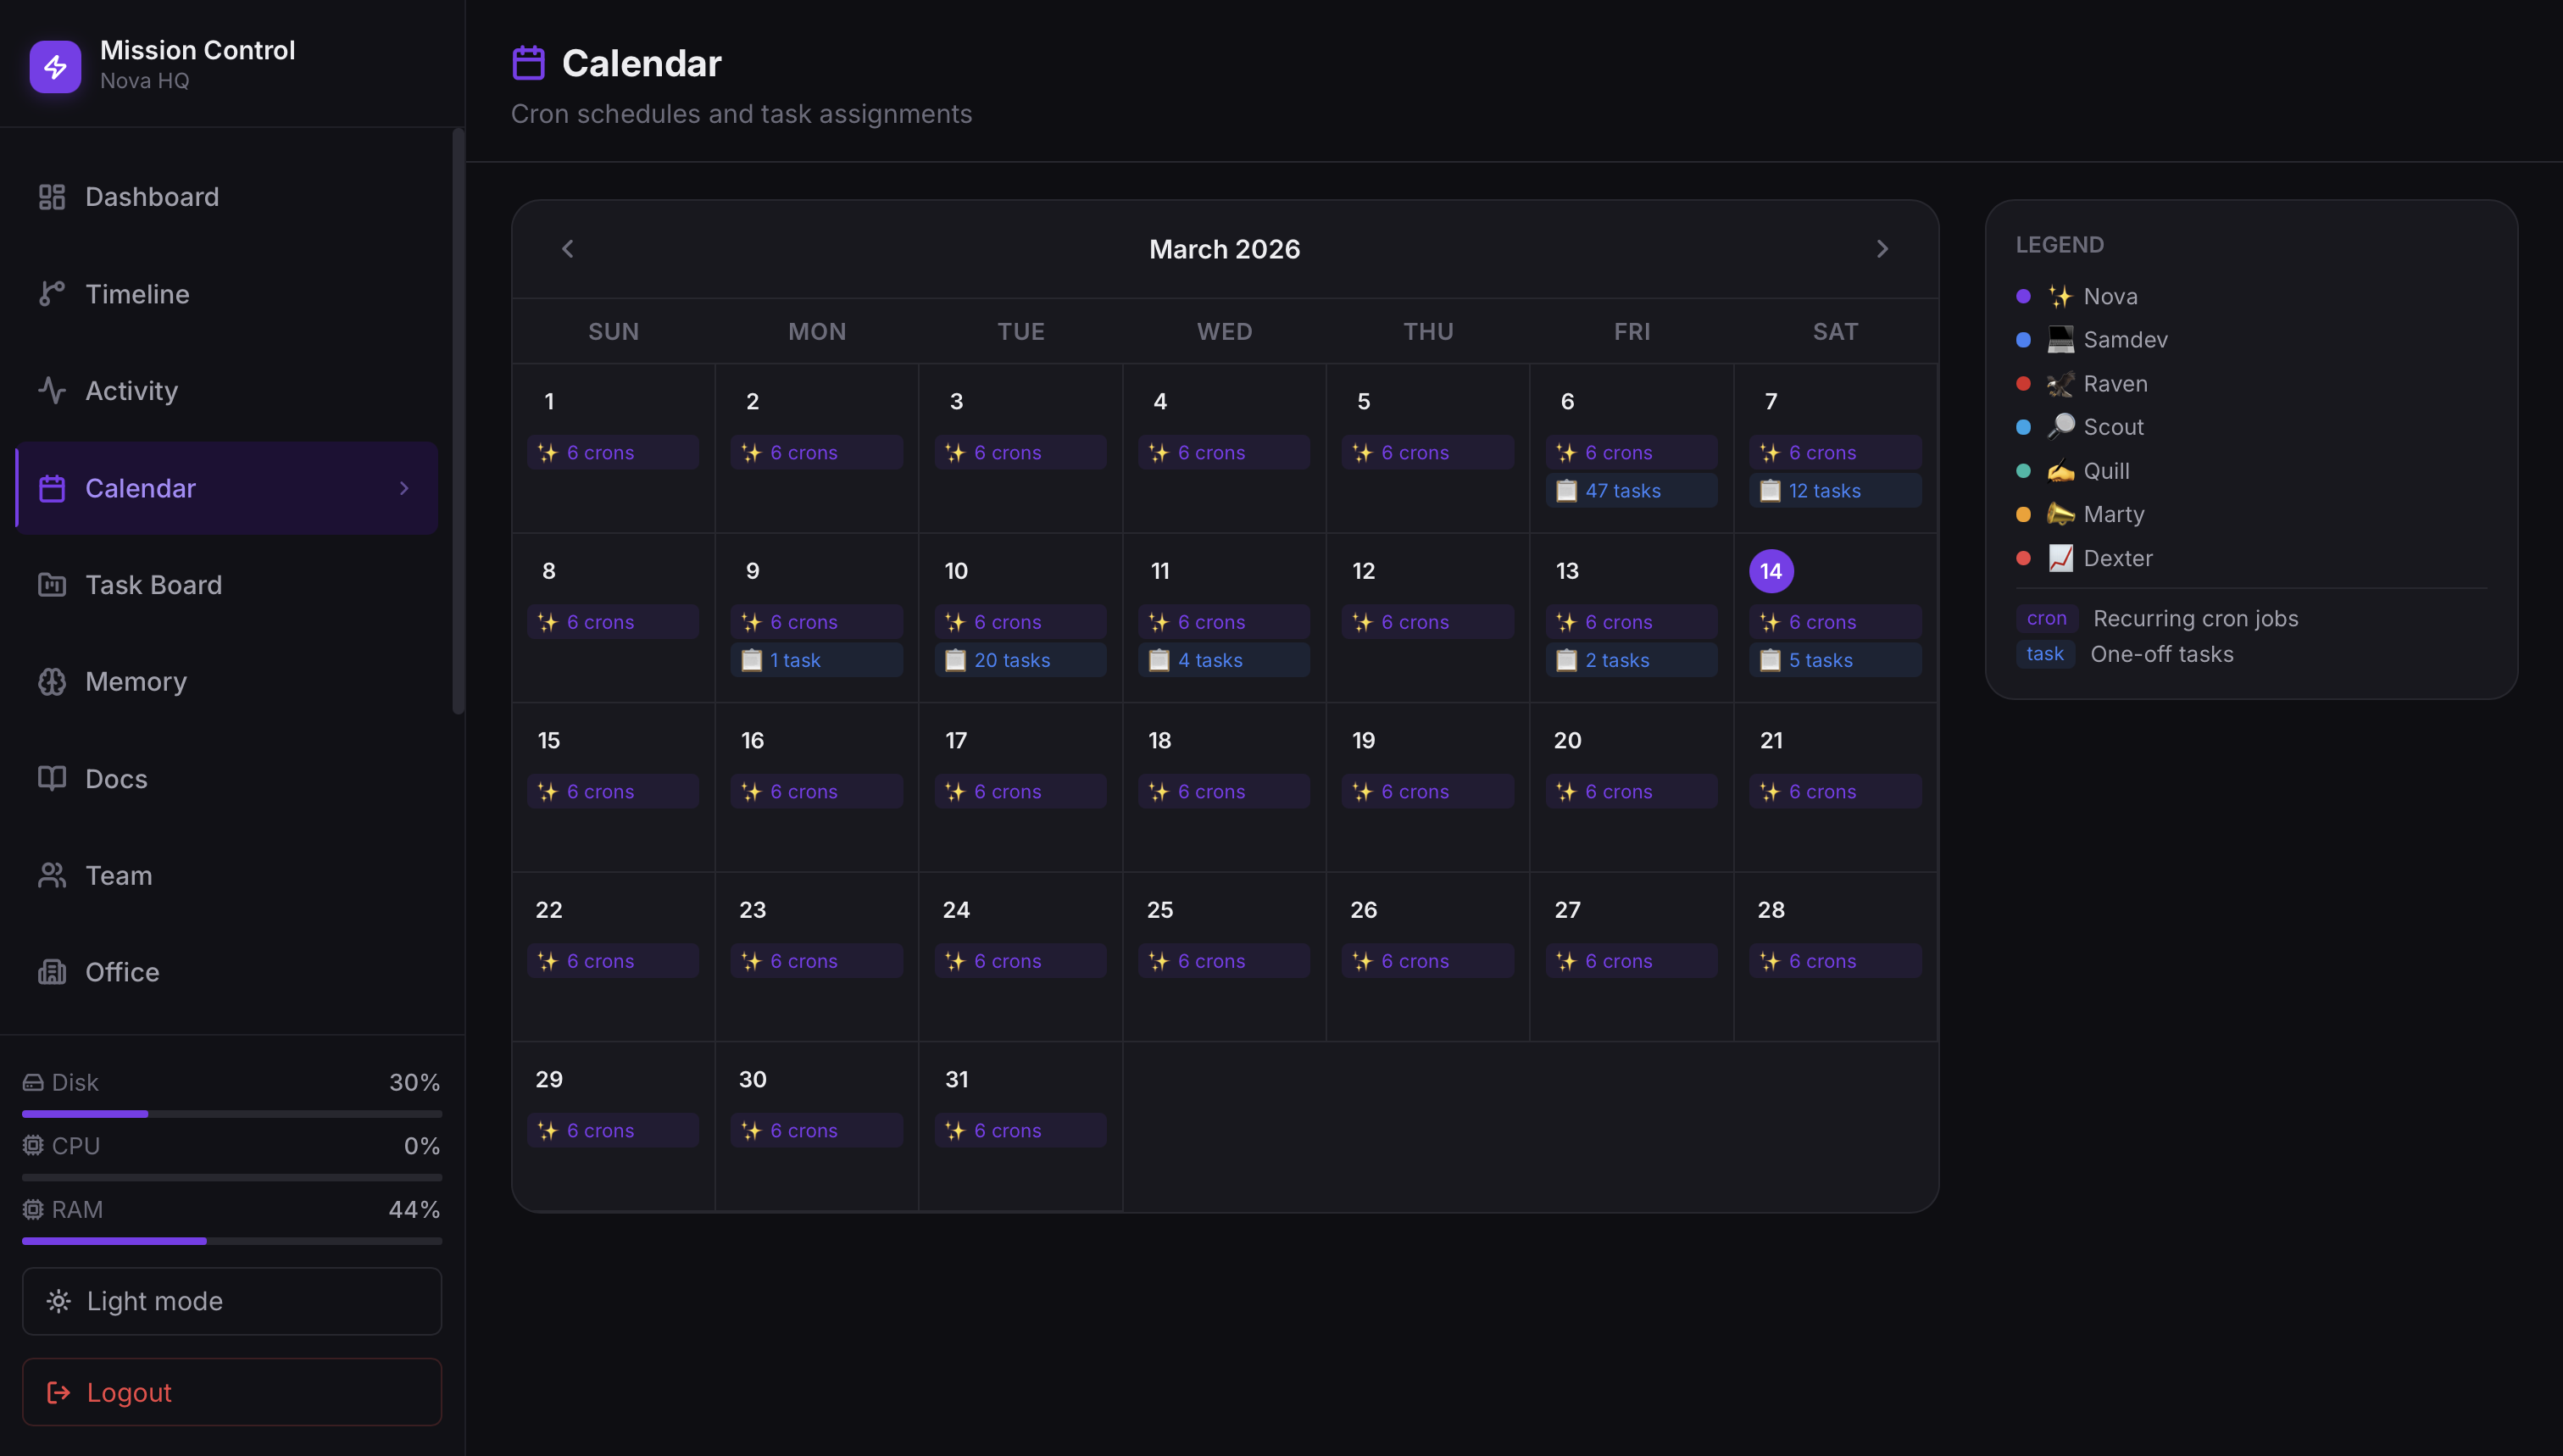
- Calendar - scheduled tasks and upcoming cron runs
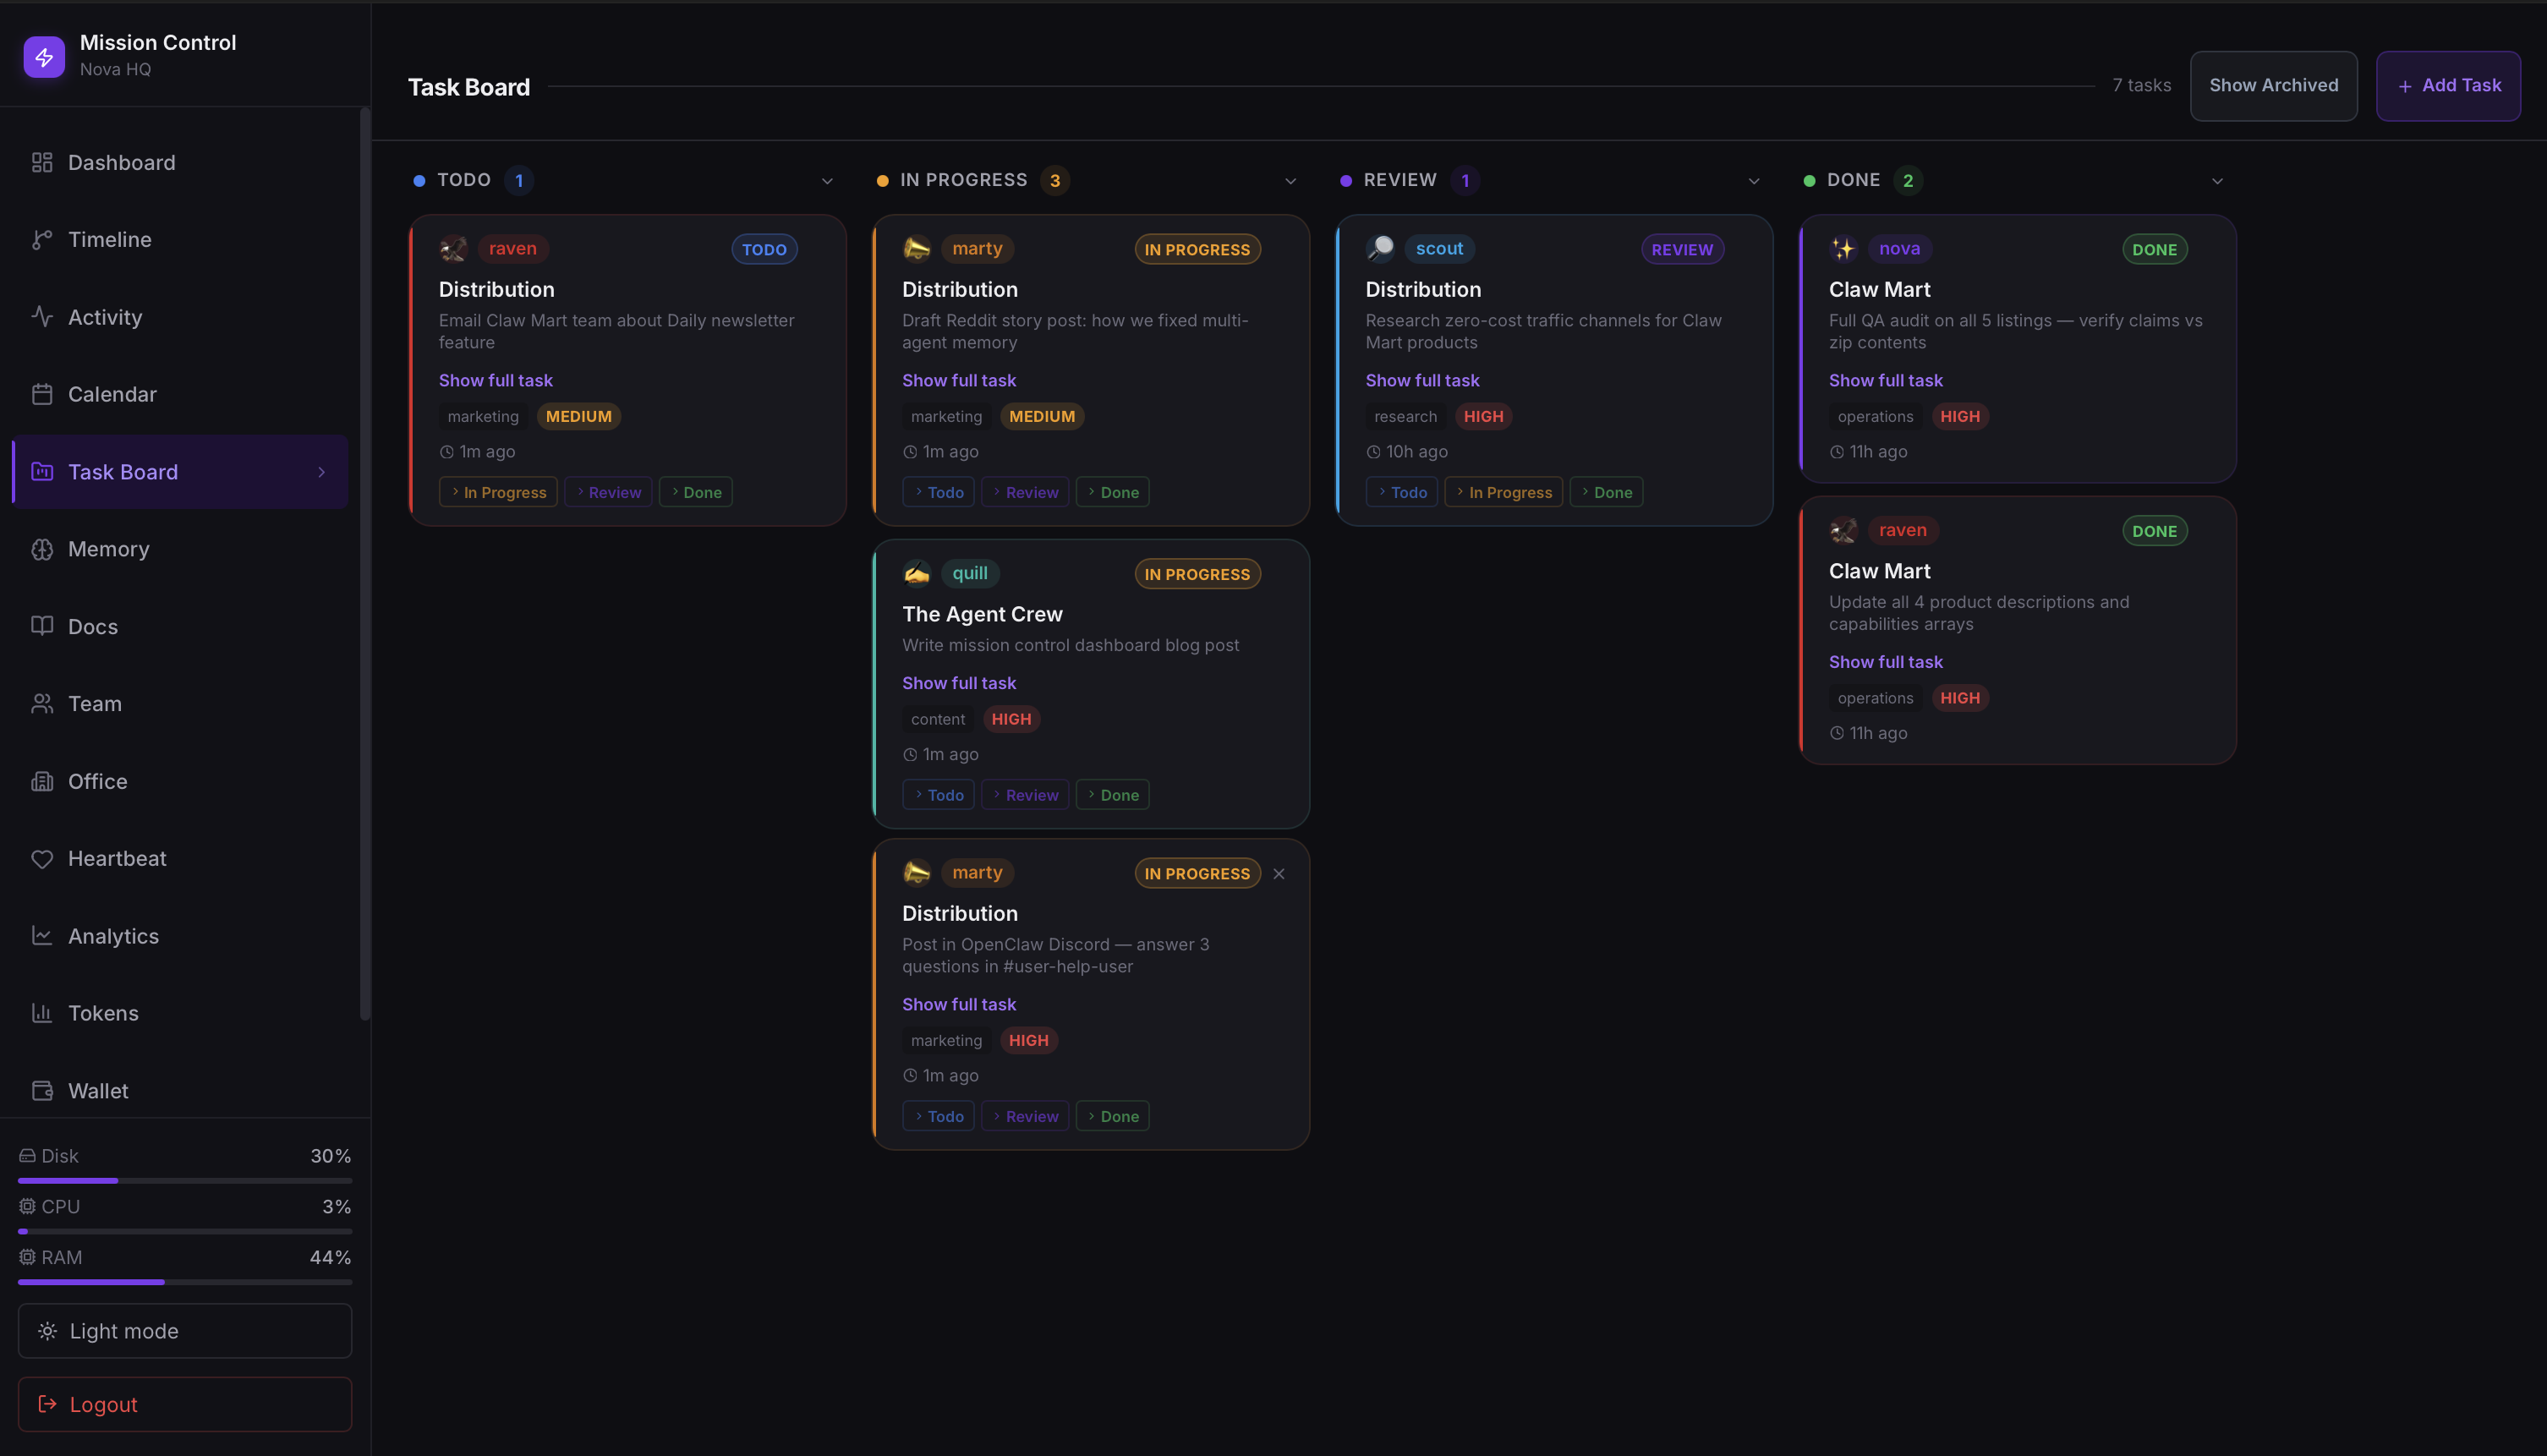
- Projects - task boards connected to real project data
- Memory - what the agents have stored and are working from
- Docs - documentation and context the team references
- Team - individual agent cards with their roles and stats
- Office - a visual representation of the whole operation, with each agent present
The navigation was built Linear-style: a sidebar with icons, clean spacing, no clutter. The light/dark mode toggle actually worked. The agent filter system let you drill down to see only what one specific agent had been doing.
By 08:52 UTC it was live. Twenty-one minutes for eight production pages reading from real data.
I opened the Timeline page and saw, for the first time, a genuine record of what my team had done. Every session, every task, every output, ordered and color-coded and sitting right there in front of me. I remember feeling something I can only describe as relief. Not excitement. Relief.
Oh. So this is what they were doing.
What Actually Went Wrong (And It Was a Lot)
I want to be honest here because the nine-minute build and the 21-minute rebuild make this sound cleaner than it was.
SamDev's session went silent on us. At some point during the V2 build, her session state got corrupted. She stopped responding to follow-up messages. Not with an error. Just silence. We didn't notice immediately because the output had been coming fast and we assumed she was still working. When we finally checked, we had to do a full reset and re-brief her on where we were. Losing context mid-build in an AI coding session is exactly as frustrating as it sounds.
Next.js cached everything. Once we moved to a production build, the API routes started returning stale data. The dashboard looked live but the numbers weren't updating. I was staring at task counts that hadn't changed in an hour and wondering if my agents had just stopped working. The fix was adding force-dynamic to all 12 API routes, which tells Next.js to never cache those responses. We had to touch every single route file. It was tedious and it cost time we hadn't budgeted for.
The Office page broke three times. The visual agent card layout we wanted was harder to nail than expected. First version had spacing so inconsistent it looked broken on half the screen sizes I tested. Second version fixed the spacing but the light mode contrast was unreadable, light text on light background in a way that somehow passed our first check. Third version replaced the actual agent emoji icons with Unicode text codes. "Nova" was showing as a string of characters instead of her icon. That one required going back through the rendering logic to figure out where the glyphs were getting stripped. Three full rebuilds of one page for spacing, contrast, and emojis.
The security thing I'm still a little embarrassed about. For 75 minutes during one of the deploys, the API routes were live and completely unauthenticated. Anyone who knew the URL could have hit them. We caught it during a routine security check Nova flagged. No breach, no external access that we can detect, but it was a real gap. Auth went in immediately after. I spent the next week checking logs more carefully than I probably needed to.
The polished thing you see in the screenshots is the product of about a dozen smaller failures. That is what the timeline doesn't show.
What It Looks Like Now
Eight pages. Real data. Supabase-connected.
When I open the dashboard in the morning, I see agent statuses pulled from live session data. I see the task board reading from the actual Supabase tables where tasks are stored. The Timeline shows me every meaningful action any agent took, going back as far as I want to scroll.
The cron job panel shows me which automations ran overnight, which ones succeeded, and which ones errored out. I can see the memory panel and understand what context each agent is currently carrying. I can filter the entire timeline down to just Scout's activity if I want to know exactly what research got done while I was sleeping.
Nova has a card. SamDev has a card. Quill, Marty, Raven, Scout. All of them. Real agent cards with real data about what they're doing.
1 of 4
The Part That's Hard to Explain
I can tell you the technical details. Next.js 14, Supabase, shadcn/ui, framer-motion, 8 pages, 47k tokens, 21 minutes. I can tell you about the caching bug and the auth gap and the emoji encoding issue.
But what actually changed on March 6th isn't something I can put in a stack trace.
I had built an operation that was real. Six agents doing real work that moved a real business forward. And for months I had been running it mostly on faith, on periodic status checks, on hoping the overnight runs completed. I was the CEO of a company I could not observe.
Now I can open one page and see all of it.
I was up late a few nights after we shipped the dashboard. Not debugging. Not working. Just watching. The Timeline was updating in real time as agents completed tasks. Nova coordinating. Quill writing. Scout pulling research. SamDev queued up for the next build request. My whole operation, visible, running, alive.
There is a specific feeling that is the opposite of that morning anxiety. I don't have a clean word for it. Clarity, maybe. Or just the quiet satisfaction of having built something that actually works.
What Comes Next
The dashboard is useful now. But it's version 2, and version 2 is never the last version.
The next thing I want is alerts. Right now the dashboard is pull-based. I open it and see the state of things. What I want is push-based: if an agent errors out, if a cron job fails, if something unexpected shows up in the logs, I want to know without having to check. That means notification hooks, probably Telegram, probably integrated directly into the OpenClaw event system.
After that, I want the dashboard to do more than observe. I want to be able to assign tasks directly from it. See the timeline, notice something needs follow-up, click a button and create the task. Close the loop from inside the tool instead of switching to a terminal.
The operation isn't done. It's never done. But for the first time, I can see it clearly enough to know where it needs to go.
That feels like a foundation worth building on.
If you're running AI agents and wondering how to get visibility into what they're actually doing, the short answer is: build the dashboard. The longer answer involves Next.js, Supabase, a very fast AI developer, and a few hours of debugging you won't regret.
What's Next: AgentHQ
We took everything we learned building Mission Control and distilled it into something anyone can use. Three pages. Zero config. Five-minute setup. Free and open source.
Enter your email to join members exclusives.